Overview
Revenue dashboards are available directly in the Lago application and are the default landing experience after login, ensuring immediate visibility into key financial indicators. The same datasets are accessible through the Lago API, allowing teams to integrate revenue analytics into external BI tools, internal dashboards, or financial workflows. The analytics layer is designed to be production-ready and extensible, supporting standard reporting needs while allowing customization for advanced use cases.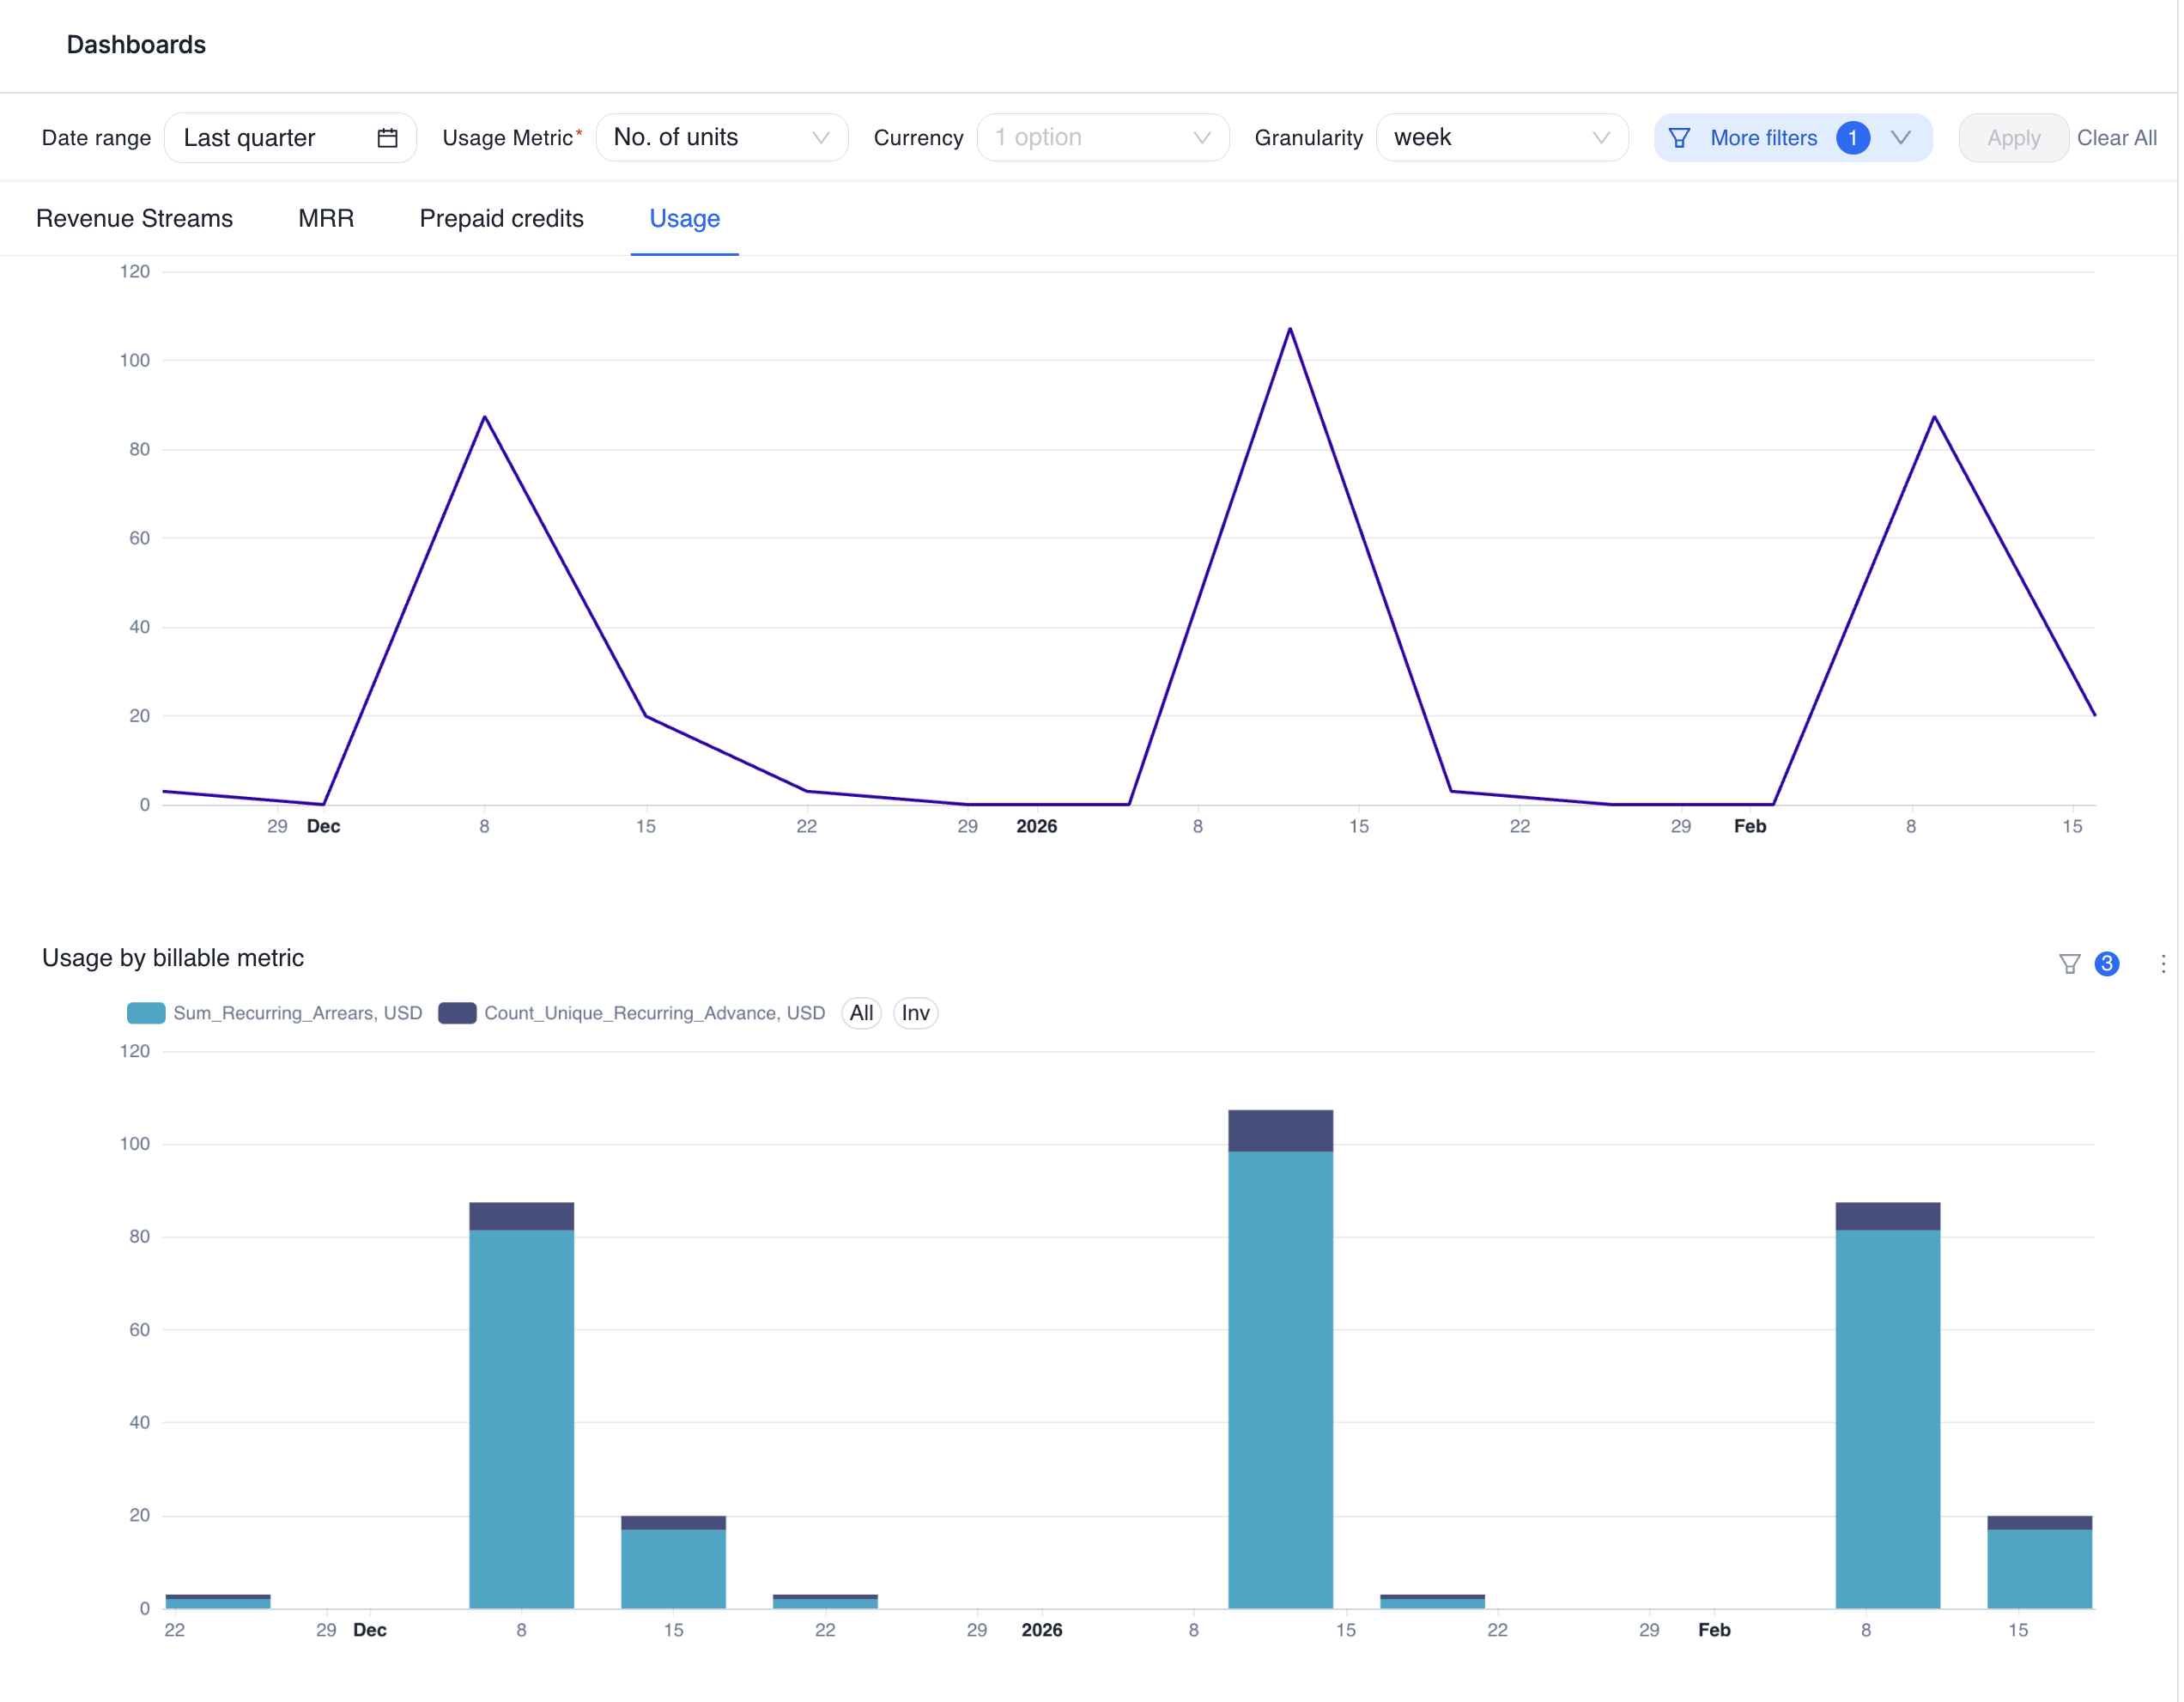
Architecture and composability
Lago’s analytics interface is built on Apache Superset, an open-source data visualization and dashboarding platform. This foundation enables:- Fully composable dashboards
- A wide range of visualization types
- Reusable charts and reporting components
- Flexible metric definitions and breakdowns
Finance reports
Lago includes standard financial reporting views required by modern subscription and usage-based businesses. These reports include, but are not limited to:- Revenue streams
- Monthly Recurring Revenue (MRR)
- Revenue breakdown by customer, subscription, or product
- Time based revenue evolution
Usage and credits reports
In addition to financial metrics, Lago provides detailed usage analytics, including:- Credit consumption over time
- Usage distribution across customers or subscriptions
- Breakdown of metered events by product or feature
Filters and dimensions
All dashboards support flexible filtering, time aggregation, and multidimensional analysis. Users can apply filters across relevant business attributes and time ranges to focus on specific subsets of data. Metrics can be aggregated at different time intervals to support both high level trend analysis and granular operational review. Reports can also be broken down across multiple dimensions, enabling comparative analysis and deeper insight into performance drivers. This exploration model allows teams to investigate data directly within Lago without requiring external processing.Data export
All charts and datasets can be exported in standard formats:- JSON
- CSV
- Excel
Data refresh strategy
To ensure fast and consistent performance across both the UI and API, Lago uses a strategic caching layer for revenue analytics. Revenue and analytics datasets are refreshed daily around 12:00 AM UTC. As a result:- Dashboards and API endpoints may not reflect same day billing changes immediately.
- There may be a short delay between transactional events and their appearance in analytics views.