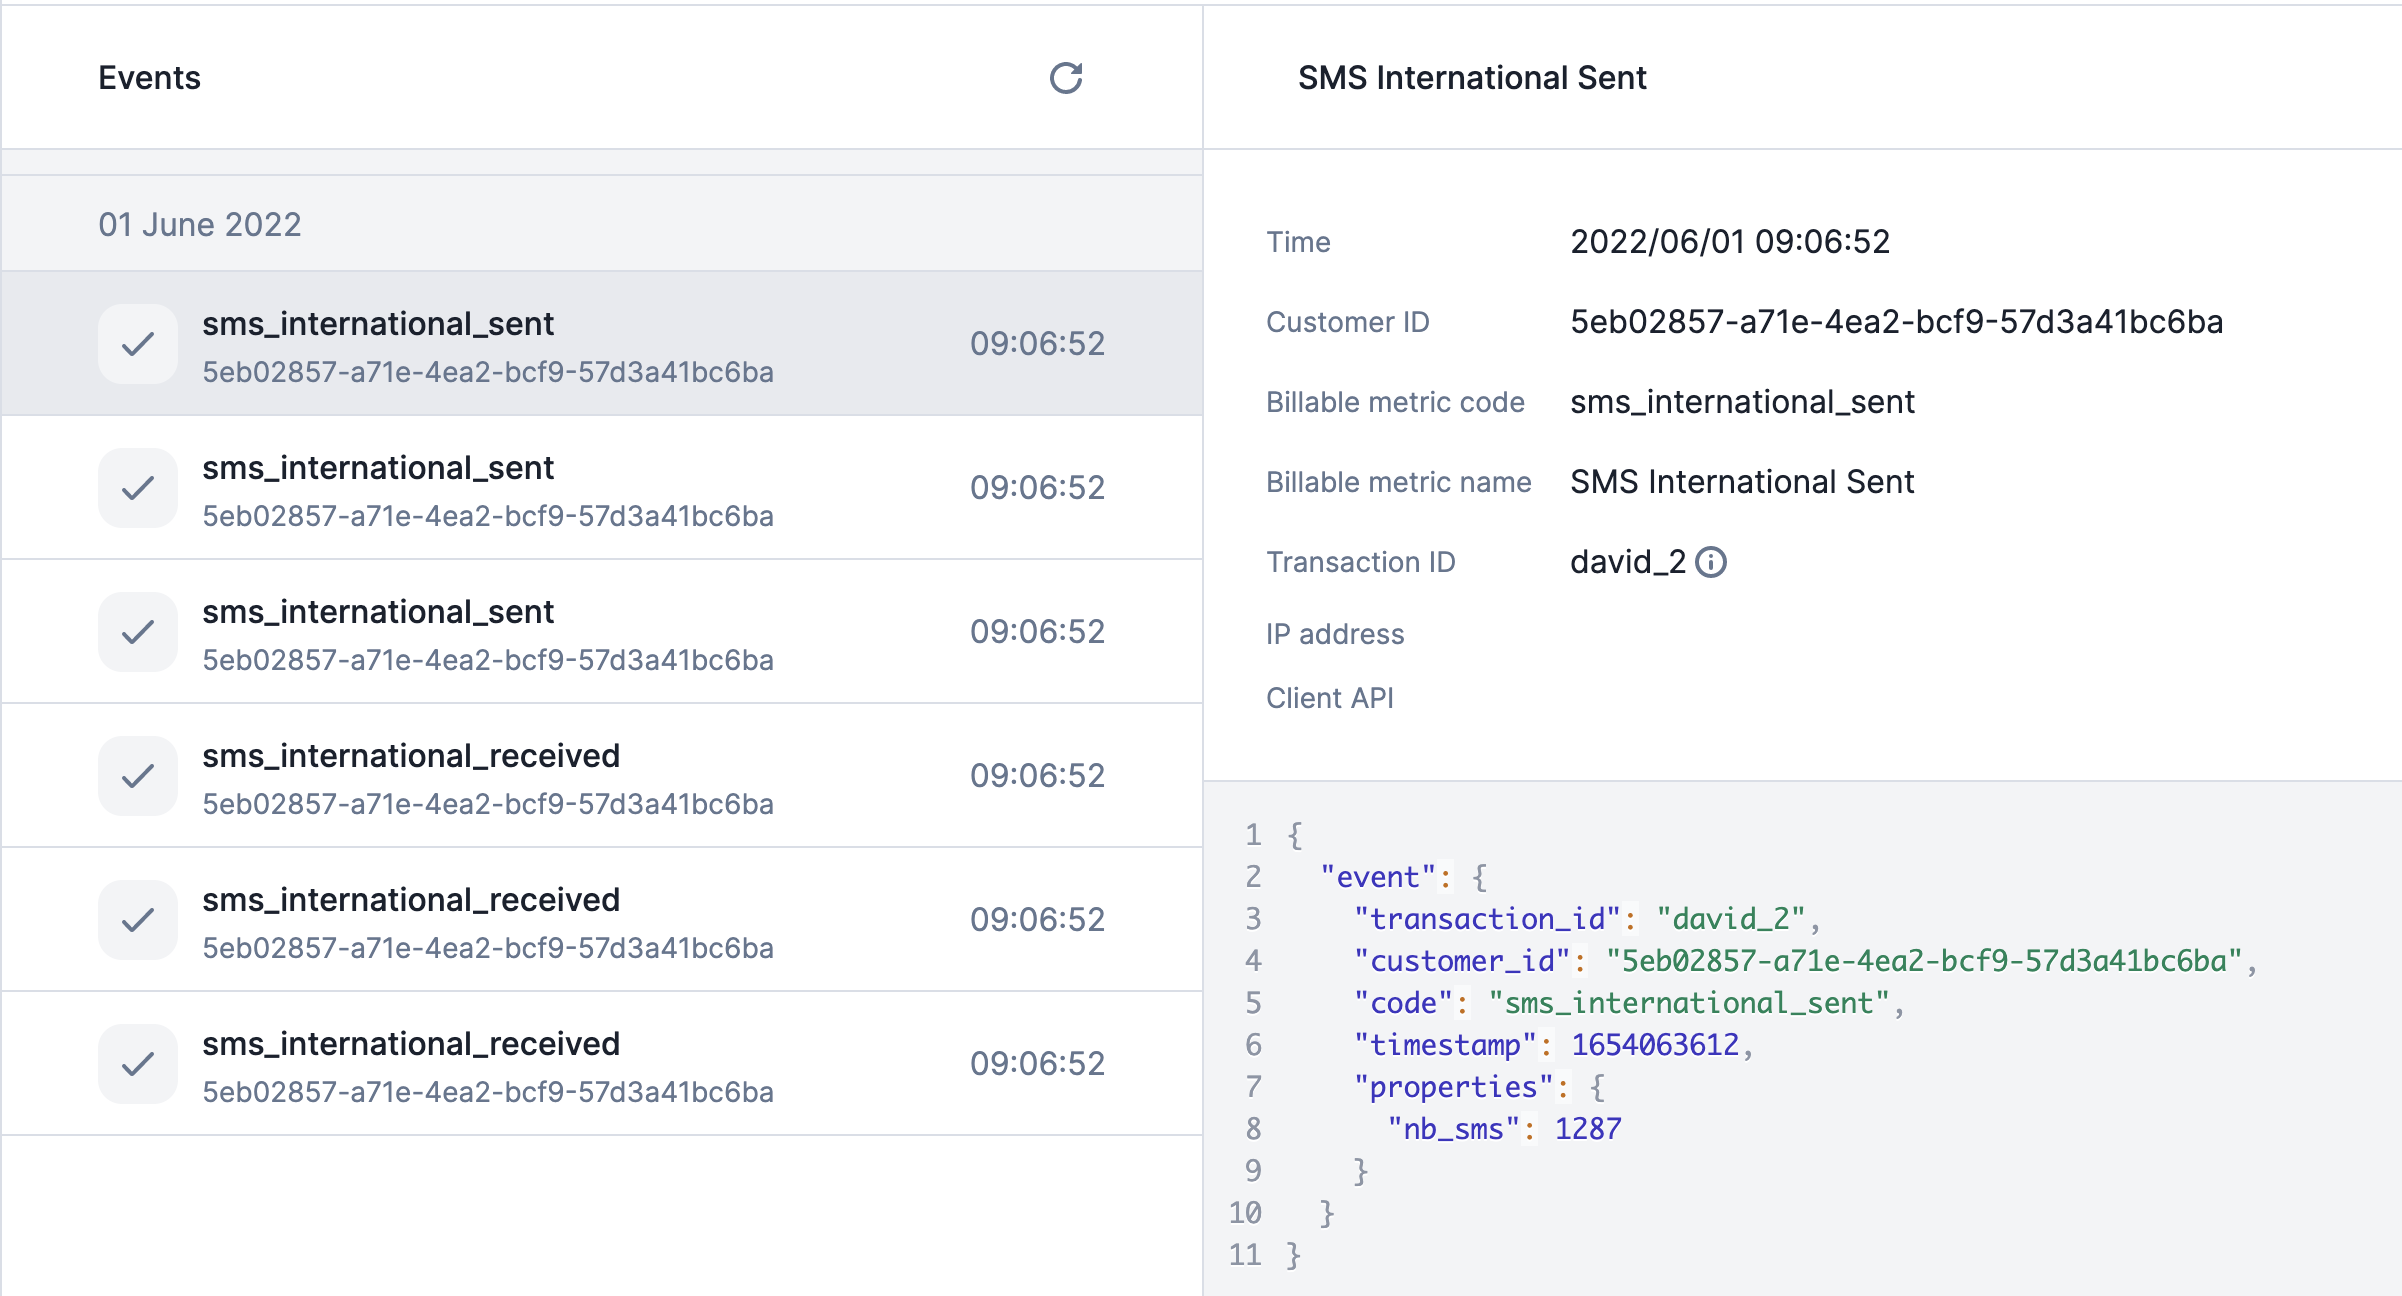
You can monitor every event flowing into Lago from the UI. This is your primary tool for verifying that your integration is working and debugging any issues.
1
Open the events list
Go to the Developers section in the sidebar, then click the Events tab.
2
Browse ingested events
The UI shows the latest 20 events by default. Scroll down to load more.
3
Inspect a specific event
Click any event to see its details:
Time: timestamp of the received event
Customer ID: the ID of your customer
Billable metric code: code of the billable metric linked to the event
Billable metric name: name of the billable metric linked to the event
Transaction ID: unique transaction_id used as the idempotency key
IP Address: IP address of the event sender
Client API: Lago Client API used to send the event
Event payload: the full JSON arguments sent in the request
If an event is not shown in the UI, it has not been ingested.
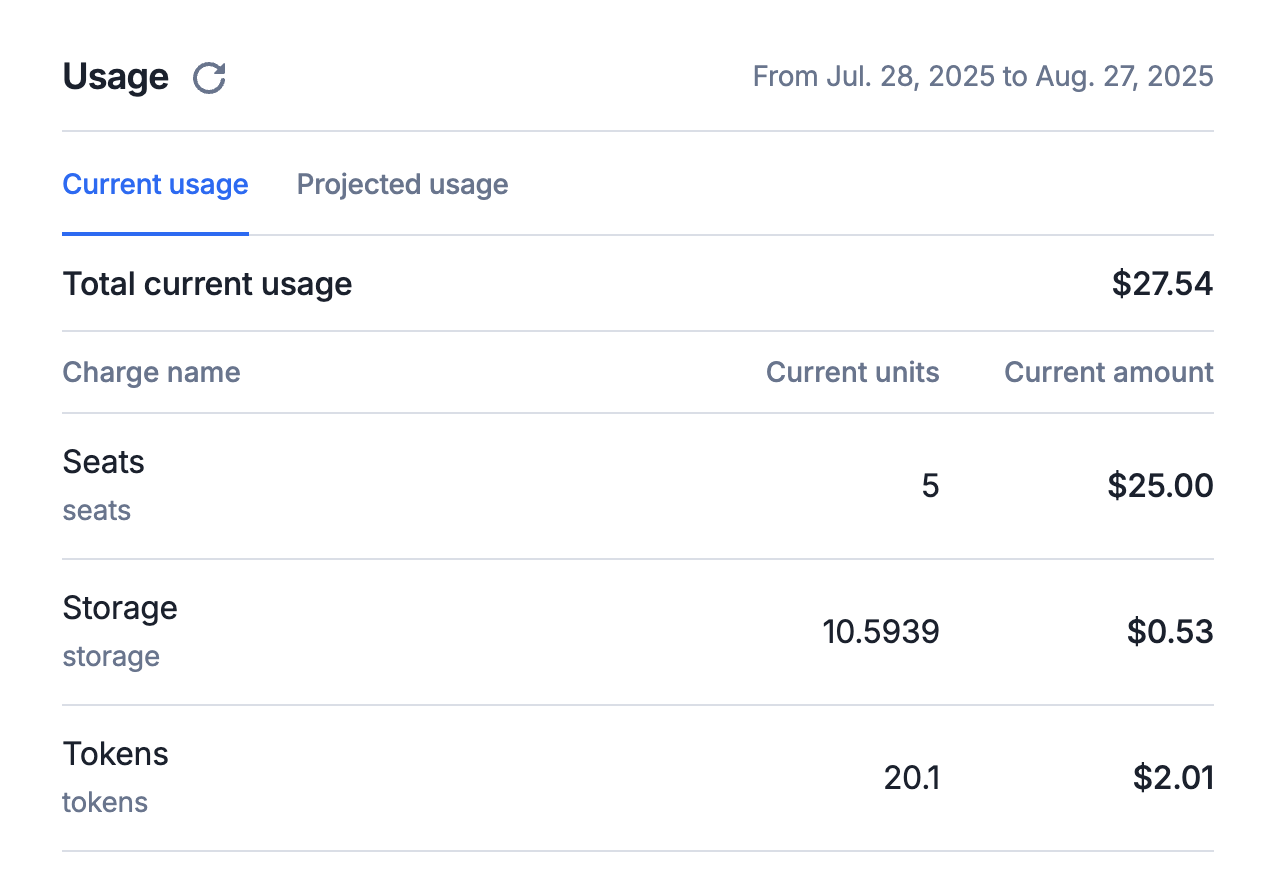
The current usage endpoint retrieves real-time usage data for the current open billing period.
Because this billing period is still ongoing, invoice details are subject to change as new usage continues to accrue.Whether it’s fetched from the UI or the API, the response includes:
Aggregated usage data for the current period: Total units consumed and total customers’ cost (so far)
Detailed breakdowns per metric: Units and amounts by metric and optional sub-breakdowns by filters or groupings (e.g., per project, environment, or AI models)
Since the billing period is not yet finalized, treat the retrieved data as provisional. Final invoice values may differ.
Events sent with a timestamp in the future are taken into account in current usage. If you terminate the
subscription before that timestamp, the event is ignored in the termination invoice.
use lago_client::LagoClient;use lago_types::requests::customer_usage::GetCustomerCurrentUsageRequest;// Reads LAGO_API_KEY and LAGO_REGION (or LAGO_API_URL) from the environment.let client = LagoClient::from_env()?;let request = GetCustomerCurrentUsageRequest::new( "__EXTERNAL_CUSTOMER_ID__".to_string(), "__EXTERNAL_SUBSCRIPTION_ID__".to_string(),);let usage = client.get_customer_current_usage(request).await?.customer_usage;
The response returns the open period and its running totals. Amounts are in cents of the plan currency. charges_usage holds one entry per charge, with units, events_count and amount_cents.
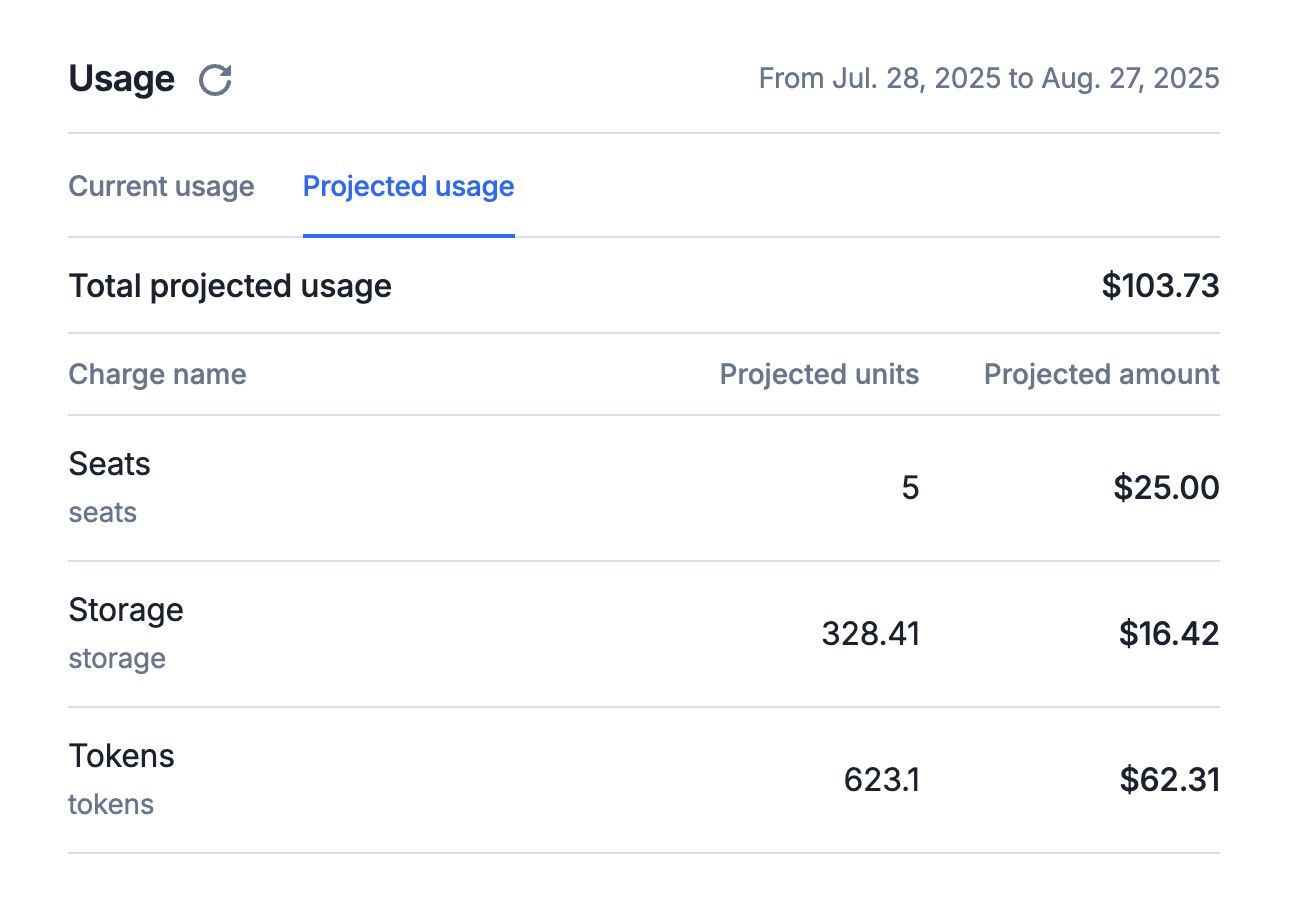
Another endpoint provides an estimate of usage and billing amounts projected through the end of the current billing period.
It uses current consumption trends and billing configuration to forecast the likely totals at period close. Projected usage is listed under the projected usage endpoint.Whether it’s fetched from the UI or the API, the response includes:
Projected total usage units and estimated billing amount for the full billing period
Per-metric projections, including: Forecasted units and amounts for each billable metric and projections broken down by optional sub-filters or groups (e.g., per project, environment, or AI models)
Recurring metrics, such as Seats, typically remain stable over time, unlike metered metrics which fluctuate. The projected usage for a recurring metric is therefore assumed to equal its current usage.
The past usage endpoint allows you to retrieve customer usage data for closed billing periods.
Once a billing period has ended and is marked as closed, the associated usage data becomes final and immutable, ensuring consistency in billing and reporting.Modifying the price of a metric, or even deleting a metric, has no effect on past usage or previously issued invoices.
Once a billing period is closed and its associated invoice is finalized, the past usage quantities, pricing, and resulting fees are locked.
When a charge defines presentation group keys, the current, projected, and past usage responses include a units-only breakdown of each charge’s usage across those keys. This is purely for visibility; it never affects the amounts.Where the breakdown appears depends on whether the charge also has pricing group keys:
No pricing group keys: the breakdown sits at the charge level, in a presentation_breakdowns array:
Pass the optional filter_by_presentation query parameter to limit the response to a subset of the configured presentation keys. For example, filter_by_presentation=["region"] collapses a region · city breakdown down to region only. The parameter name follows the same filter_by convention as the current usage endpoint.
The current, projected, and past usage endpoints above are scoped to a single subscription. When you need to look at usage across customers, plans, or metrics, or to break consumption down over a time window, use the usage analytics endpoint (GET /analytics/usage).This endpoint aggregates the units consumed and the amounts billed, and lets you slice that data with a set of filters. It is the right tool when you want to answer questions like “how many units did this metric generate per day last month?” or “why was this invoice billed the way it was?”.
Usage analytics is part of Lago’s analytics layer and is a premium feature. The same data also powers the analytics dashboards in the UI.
All filters are optional and can be combined. When several filters are set, they are applied together (logical AND), progressively narrowing the result set.
Filter
Type
Description
time_granularity
daily | weekly | monthly
Splits the result into time buckets at the chosen resolution. See The date window below.
from_date
date (YYYY-MM-DD)
Start of the period the analytics are computed for.
to_date
date (YYYY-MM-DD)
End of the period the analytics are computed for.
currency
ISO 4217 (e.g. USD)
Returns amounts converted to this currency, so usage billed in different currencies can be compared on a single scale.
external_customer_id
string
Restricts the analytics to a single customer.
external_subscription_id
string
Restricts the analytics to a single subscription.
plan_code
string
Restricts the analytics to subscriptions on a given plan.
billable_metric_code
string
Restricts the analytics to a single usage-based billable metric.
is_billable_metric_recurring
boolean
Keeps only recurring (true) or non-recurring (false) metrics.
customer_type
individual | company
Filters by the type of customer.
customer_country
ISO 3166-1 alpha-2 (e.g. US)
Filters by the customer’s billing country.
Each row of the response carries the period boundaries (start_of_period_dt, end_of_period_dt), the billable_metric_code, the units consumed, and the billed amount_cents in amount_currency.
The combination of from_date, to_date, and time_granularity is what makes this endpoint useful for reconciliation.
from_date / to_date define the window the analytics cover. Set them to the start and end of a billing period to look at exactly what a given invoice was computed from.
time_granularity controls how that window is sliced. With daily, you get one row per day per metric, so you can see the units that accrued each day and the corresponding amount, rather than a single aggregated total.
This daily breakdown is the key to tracing back why a customer was invoiced a given number of units and a given amount. When an invoice total looks unexpected, query /analytics/usage over that invoice’s billing period with time_granularity=daily, filtered on the relevant external_subscription_id and billable_metric_code. The day-by-day series shows exactly when consumption spiked, lets you tie each day’s units to the amount they generated, and makes it possible to trace the invoiced total back to the underlying daily usage.
For an invoice you want to explain, set from_date and to_date to that invoice’s billing period boundaries and use time_granularity=daily. Summing the daily units and amount_cents returned reconciles back to the invoiced totals.